หน้าแรกของ IC Markets เข้าสู่ระบบ เว็บเทรดเดอร์ ติดต่อเรา
IC Markets Social IC Markets Social

Information Hub for
Serious Traders

  • เกี่ยวกับเรา
  • เปิดบัญชีเทรด
  • เปิดบัญชีเดโม่
  • เริ่มเทรด
  • เยี่ยมชมบล็อกของเรา
IC Markets Social
  • เกี่ยวกับเรา
  • เปิดบัญชีเทรด
  • เปิดบัญชีเดโม่
  • เริ่มเทรด
  • เยี่ยมชมบล็อกของเรา
March 15, 2021European_Indexes_enIC Markets

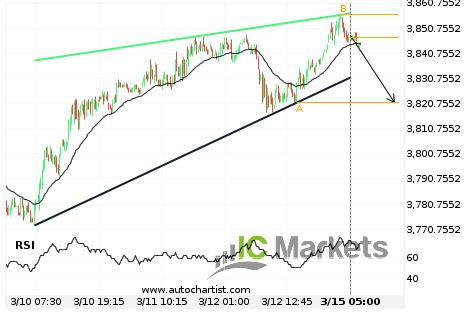
Will EU Stocks 50 Index have enough momentum to break support?

EU Stocks 50 Index is heading towards the support line of a Rising Wedge and could reach this point within the next 17 hours. It has tested this line numerous times in the past, and this time could be no different from the past, ending in a rebound instead of a breakout. If the breakout […]

Read more
March 12, 2021European_Indexes_enIC Markets

Either a rebound or a breakout imminent on France 40 Index

France 40 Index is heading towards the resistance line of a Rising Wedge. If this movement continues, we expect the price of France 40 Index to test 6038.1200 within the next 9 hours. But don’t be so quick to trade, it has tested this line numerous times in the past, so this movement could be […]

Read more
March 11, 2021European_Indexes_enIC Markets

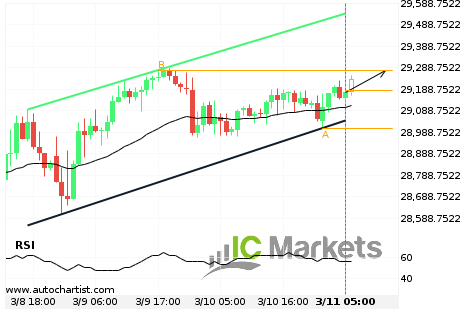
Will Japan 225 Index have enough momentum to break resistance?

Japan 225 Index is heading towards the resistance line of a Channel Up and could reach this point within the next 17 hours. It has tested this line numerous times in the past, and this time could be no different from the past, ending in a rebound instead of a breakout. If the breakout doesn’t […]

Read more
March 10, 2021European_Indexes_enIC Markets

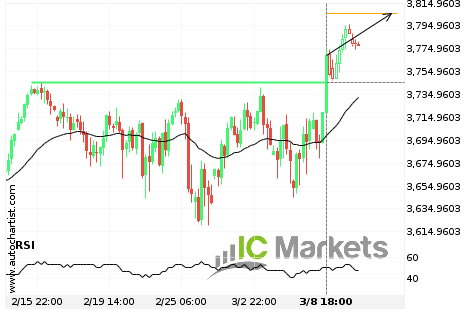
Should we expect a bullish trend on EU Stocks 50 Index?

The breakout of EU Stocks 50 Index through the 3745.3601 price line is a breach of an important psychological price that is has tested numerous in the past. If this breakout persists, we expect the price of EU Stocks 50 Index to test 3805.7051 within the next 3 days. One should always be cautious before […]

Read more
March 8, 2021European_Indexes_enIC Markets

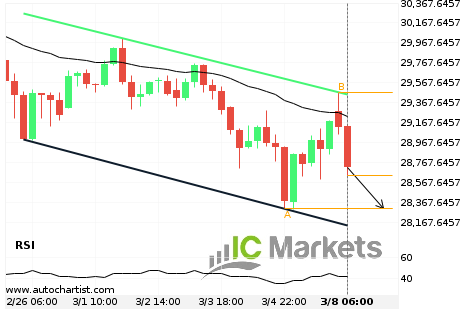
Japan 225 Index approaching support of a Channel Down

Japan 225 Index is approaching the support line of a Channel Down. It has touched this line numerous times in the last 11 days. If it tests this line again, it should do so in the next 2 days.

Read more
March 3, 2021European_Indexes_enIC Markets

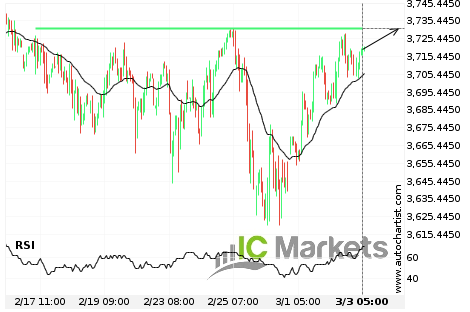
Breach of important price line imminent by EU Stocks 50 Index

EU Stocks 50 Index is moving towards a line of 3730.8999 which it has tested numerous times in the past. We have seen it retrace from this positions in the past, so at this stage it isn’t clear whether it will breach this price or rebound as it did before. If EU Stocks 50 Index […]

Read more
March 2, 2021European_Indexes_enIC Markets

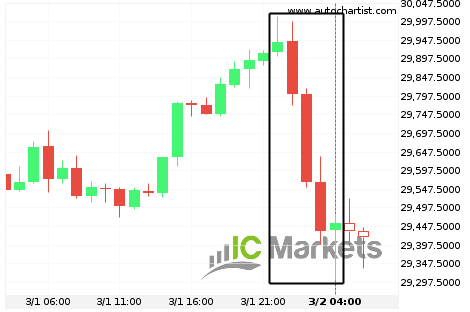
Japan 225 Index is on its way down

Japan 225 Index has experienced an exceptionally large movement lower by 1.62% from 29,914 to 29,456 in the last 5 hours.

Read more
March 1, 2021European_Indexes_enIC Markets

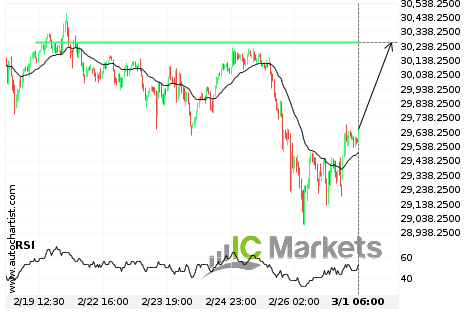
Japan 225 Index approaching important 30266.0000 price line

Japan 225 Index is approaching the resistance line of a Resistance. It has touched this line numerous times in the last 10 days. If it tests this line again, it should do so in the next 2 days.

Read more
February 26, 2021European_Indexes_enIC Markets

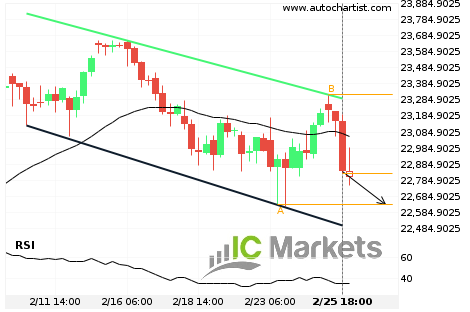
Either a rebound or a breakout imminent on Italy 40 Index

Italy 40 Index is heading towards the support line of a Channel Down. If this movement continues, we expect the price of Italy 40 Index to test 22633.1000 within the next 3 days. But don’t be so quick to trade, it has tested this line numerous times in the past, so this movement could be […]

Read more
February 25, 2021European_Indexes_enIC Markets

Japan 225 Index approaching important 30464.5000 price line

Japan 225 Index is approaching the resistance line of a Resistance. It has touched this line numerous times in the last 8 days. If it tests this line again, it should do so in the next 22 hours.

Read more
  • 1
  • 2
  • 3
  • …
  • 9
  • 10
  • 11
  • 12
  • 13
  • 14
  • 15
  • 16

Recent Posts

  • Either a rebound or a breakout imminent on SILVER
  • GOLD Nível visado: 2976.3601
  • A potential bearish movement on GOLD
  • มีโอกาสเกิดการเคลื่อนตัวแบบ bearish บน GOLD
  • Posible gran movimiento en el AUDJPY

Recent Comments

    Translation


     Edit Translation

    เปิดบัญชีและฝากเงินได้แบบทันที

    เทรดได้ภายในไม่กี่นาที!

    เริ่มต้น ลองบัญชีเดโมได้ฟรี

    การเทรดฟอเร็กซ์

    • ภาพรวมของบัญชี
    • เปิดบัญชี
    • ใช้งาน Web Trader

    รายละเอียดของการซื้อขาย

    • สเปรดและค่าคอมมิชชั่น
    • ขอบเขตของตลาด
    • ช่วงเวลาซื้อขาย
    • การเพิ่มเงิน
    • การถอนเงิน

    เกี่ยวกับ IC Markets

    • Help Centre
    • ทำไมถึงต้องเป็น IC Markets
    • กฎระเบียบ
    • เอกสารทางกฎหมาย
    • ติดต่อเรา


    Forex Trading

    • Accounts Overview
    • Open an Account
    • Launch Web Trader

    Trading Specifications

    • Spreads and Commissions
    • Range of Market
    • Trading Hours
    • Funding
    • Withdrawal

    About IC Markets

    • Chat with a Specialist 24/7
    • Why IC Markets
    • Regulation
    • Legal Documents
    • ติดต่อเรา

    ข้อความจำกัดความรับผิดชอบ: เนื้อหาข้อมูลนี้เป็นเนื้อหาด้านการตลาดซึ่งได้ถูกเผยแพร่เพื่อวัตถุประสงค์ในการให้ข้อมูลเท่านั้น เนื้อหานี้ไม่ได้ประกอบไปด้วยและไม่ควรถือว่าประกอบไปด้วยคำแนะนำหรือการเสนอแนะด้านการลงทุน หรือการแนะนำให้มีการดำเนินการใดๆ กับตราสารทางการเงิน วิดเจ็ตที่แสดงอยู่ภายในเป็นของผู้จัดทำจากภายนอกและ IC Markets ไม่มีส่วนรับผิดชอบใดๆ เกี่ยวกับเนื้อหาและผลกระทบที่มีต่อการเทรด

    สงวนลิขสิทธิ์สำหรับเนื้อหาทั้งหมด ความคิดเห็นของผู้จัดทำอาจไม่สอดคล้องกับความคิดเห็นของผู้จัดทำบล็อก เมื่อมีการคัดลอกเนื้อหาจากเว็บไซต์นี้หรือมีการเชื่อมโยงไปยังฟีด RSS เพื่อเผยแพร่บทความของเรา ผู้ที่ทำการคัดลอกจะต้องใส่ลิงก์ไปยัง IC Markets หรือมีการระบุแหล่งที่มาในรูปแบบ ‘IC Markets Blog’ สำหรับคำถามโดยทั่วไปโปรดติดต่อสำนักงานบรรณาธิการผ่านทางแบบฟอร์มบนหน้าติดต่อเรา

    คำเตือนเกี่ยวกับความเสี่ยง: การเทรดตราสารอนุพันธ์มีความเสี่ยงในระดับสูงกับเงินทุนของคุณและคุณควรทำการเทรดด้วยเงินที่คุณ สามารถรับการขาดทุนได้เท่านั้น การเทรดตราสารอนุพันธ์อาจไม่เหมาะกับนักลงทุนทุกท่าน ดังนั้นโปรดทำความเข้าใจกับความเสี่ยงที่เกี่ยวข้องและหาคำแนะนำที่เป็นอิสระหากจำเป็น นักลงทุนควรศึกษา Product Disclosure Statement (PDS) ก่อนทำธุรกรรมใดๆ กับเรา

    เนื้อหาข้อมูลที่ถูกแสดงอยู่บนหน้านี้เป็นข้อมูลโดยทั่วไปเท่านั้นและไม่ได้มีการคำนึงถึงสถานการณ์ส่วน ตัวของคุณ, เป้าหมายทางการเงิน หรือความต้องการของคุณ คุณเป็นผู้พิจารณาว่าผลิตภัณฑ์ต่างๆ ที่เรามีให้บริการเหล่านี้ตรงกับความต้องการของคุณหรือไม่ อีกทั้งคุณไม่ควรทำการเทรดกับเราจนกว่าคุณจะเข้าใจถึงคุณสมบัติและความเสี่ยงที่เกี่ยวข้องกับผลิตภั ณฑ์ที่เรามีให้บริการ นั่นหมายความว่าคุณอาจต้องการคำแนะนำที่เป็นอิสระก่อนที่คุณจะเริ่มต้นเทรดกับเรา

    © 2022 Raw Trading Ltd | All rights reserved.
    • Sample Page